

- Your cart is empty
- Continue Shopping

Supply and Demand Dashboard PRO
Supply and Demand Dashboard PRO

$24.99
-88%Add to cart
Buy Now
Product Description
Supply and Demand Dashboard PRO
- Indicadores
- Bernhard Schweigert
- Versión: 2.2
- Actualizado: 19 septiembre 2021
- Activaciones: 5
CURRENTLY 20% OFF !!
This DASHBOARD is a very powerful piece of software working on multiple symbols and up to 9 timeframes.
It is based on our main indicator (Best reviews: Advanced Supply Demand).
The new DASHBOARD gives a great overview. It shows:
- filtered Supply and Demand values including zone strength rating,
- pips distances to/and within zones,
- it highlights nested zones,
- it gives 4 kind of alerts for the chosen symbols in all (9) time-frames.
- It is highly configurable for your personal needs!
Important Information Revealed
Maximize the potential of Supply and Demand, please visit https://www.mql5.com/en/blogs/post/725584 (User manual)
If you are new to supply demand trading read also https://www.mql5.com/en/blogs/post/720245
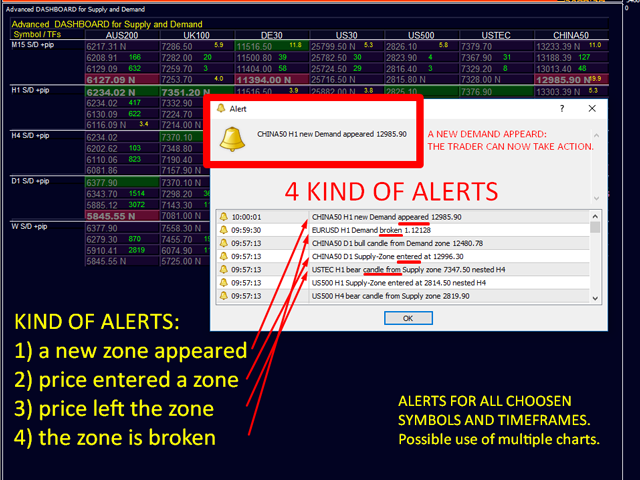
ADVANCED FEATURES: 4 KIND OF ALERTS:
- A new zone appeared.
- Price entered a zone.
- Price left the zone.
- The zone is broken.
- If you wish, you can filter all alerts for only nested zones.
- You can choose the timeframes which should be alerted.
- You can exclude symbols from the alert.
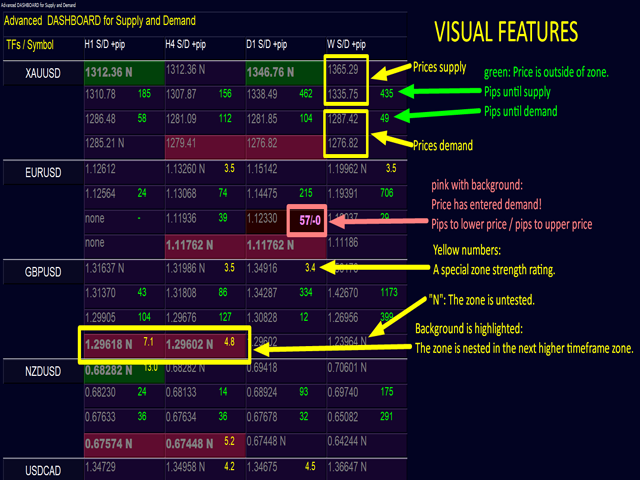
VISUAL FEATURES ON DASHBOARD
- Prices for supply and demand. (From up to down: supply upper price / supply lower price / demand upper price / demand lower price)
- Pips distances until supply and demand. Green, if price is far from zone.
- Pips distances within supply and demand. Pink and bold, if price has entered the zone. (pips to outer price / pips to inner price)
- A special zone strength rating. Yellow number, if a minimum strength is reached.
- New or tested: “N” is added to price if the zone is still untested or new.
- Nested: the background is highlighted if the zone is nested within the higher timeframe zone.
- Nested AND new: Prices for supply and demand showing in bold.
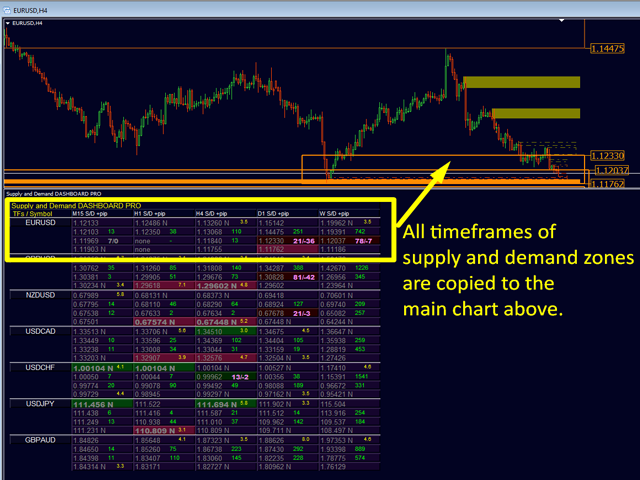
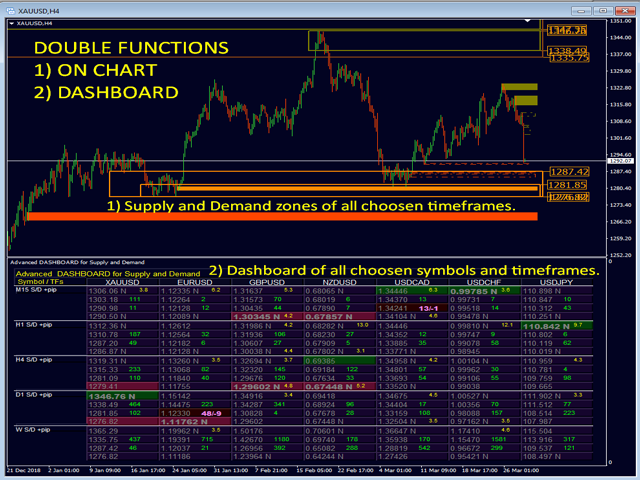
VISUAL FEATURES ON CHART
Simply drag the sub-window of the dashboard down with the mouse to see the actual chart. Click on the symbol names to change the symbol.
- All timeframes showing in the dashboard will be drawing on the chart.
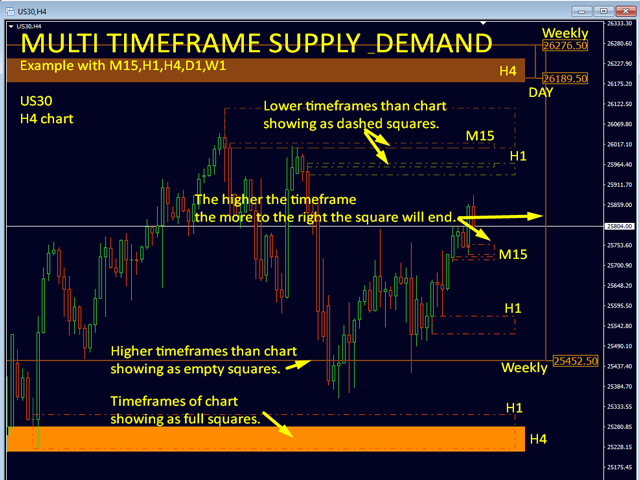
- Lower timeframes than the chart showing as dashed squares.
- Actual timeframe of chart showing as full squares.
- Higher timeframes than chart showing as empty squares.
- The higher the timeframe is the more to the right the squares end.
- Color code will show if the zone is new or tested.
- Prices can be shown on chart or not.
Indicator Parameter and SettingsThe full list is available in the User Manual.
Strategy testerATTENTION: To get the demo work in the strategy tester it needs a special setup since it’s a Multi-Symbol and Multi-Timeframe Dashboard. Also you need to prepare chart data quotes. Send me email if you need help [email protected] (You can also try instead the demo of Advanced Supply Demand which works just in a similar way.)
YOUR BENEFITS!
The most important questions for every trader regardless of what trading system is used:
- Were are the best levels to enter the market?
Enter your trade within or near a strong supply/demand zone to have the best chance of success and risk/reward. - Where is the best place for my stop loss?
Place your stop below/above a strong supply/demand zone to be the safest. - What is my best profit target?
Your exit strategy is just as important as your entry and knowing the higher time frame picture can help with this. For a buy use the next supply zone as target, for a sell use the next demand zones as target. Entering on a pullback to supply or demand to ensure that there is sufficient room for a profit margin up to higher time frame supply and demand will increase your profits.
Why we filter strong and weak zones?
The greater the imbalance, the greater the move in price. The highest probability price levels are the ones with the greatest imbalance between buyers and sellers. Without any prior warning, it reverses on the spot and drops like a stone – those are the areas of major imbalances. A big number of sellers have entered the market at that price and outnumbered the buyers. It is also very likely that, in case of a sudden sell-off, more sellers were waiting to sell just around that level.
Tips
- Read the User Manual: Click Here.
- SPECIAL: To update the MT4 chart history 1 support chart will be opened! This function can be deactivated.
- Check my news and blogs on profile for trading system and trade examples.
I will always help you if you have any questions.
I wish you many green pips in the future.
Best regards, Bernhard
Comentarios 19

56
Darryl Brown 2021.09.27 07:28 #
I rented the indicator over the weekend and I plan on using this indicator along with cs28 and impulse for binary options trading. My first day so far I made 3k from $400 (5 wins 0 loss trades total) by following his rules of all 3 indicators. His system is by far superior and worth the money spent IMO. This indicator lets you know that all entries are not good entries. I love your other indicators Bernhard but this is by far my favorite one.
222
Personally, I like the stand alone version better. But this dashboard help me alot not to open many chart and stay all the time infront of laptop to monitor the opportunity. Just use it with the main trend and TF > 30, and it give low RR and many potential setup.
Supply and Demand DASHBOARD PRO USER MANUAL.
SELECTED Supply and Demand zones.
Multiple Symbols, all Time-frames, multiple Alerts.
Highly configurable to the traders needs.
A Breakthrough Algorithm For Supply Demand Zones! That Will Further Improve Your Trading!
Supply and demand imbalances can be used on any market and timeframe: Forex, Stocks, ETFs, Commodities, Futures, Indexes, or Crypto Currencies. Use supply and demand zones to locate the exact zone to plan your Trade without expending half your life in front of your trading platform. Knowing were are supply and demand zones will help you locate turning points in any markets.
What is Supply and Demand DASHBOARD PRO?
This DASHBOARD is a very powerful piece of software working on multiple symbols and up to 9 timeframes. It is based on our main indicator (Best reviews: Advanced Supply Demand).
If you are new to supply demand trading read also https://www.mql5.com/en/blogs/post/720245

YOUR BENEFITS!
The most important questions for every trader regardless of what trading system is used:
- Were are the best levels to enter the market?
Enter your trade within or near a strong supply/demand zone to have the best chance of success and risk/reward. - Where is the best place for my stop loss?
Place your stop below/above a strong supply/demand zone to be the safest. - What is my best profit target?
Your exit strategy is just as important as your entry and knowing the higher time frame picture can help with this. For a buy use the next supply zone as a target, for a sell use the next demand zones as a target. Entering on a pullback to supply or demand to ensure that there is sufficient room for a profit margin up to higher time frame supply and demand will increase your profits.
Why we filter strong and weak zones?
The greater the imbalance, the greater the move in price. The highest probability price levels are the ones with the greatest imbalance between buyers and sellers. Without any prior warning, it reverses on the spot and drops like a stone – those are the areas of major imbalances. A big number of sellers have entered the market at that price and outnumbered the buyers. It is also very likely that, in case of a sudden sell-off, more sellers were waiting to sell just around that level.
ADVANCED FEATURES:
The new DASHBOARD gives a great overview of supply and demand with all timeframes.
- Zones are filtered with a special strength rating,
- Showing Supply and Demand values including zone strength rating,
- Showing pips distances to/and within zones,
- It highlights nested zones,
- It gives 4 kinds of alerts for the chosen symbols in up to all (9) time-frames.
- It is highly configurable for your personal needs!
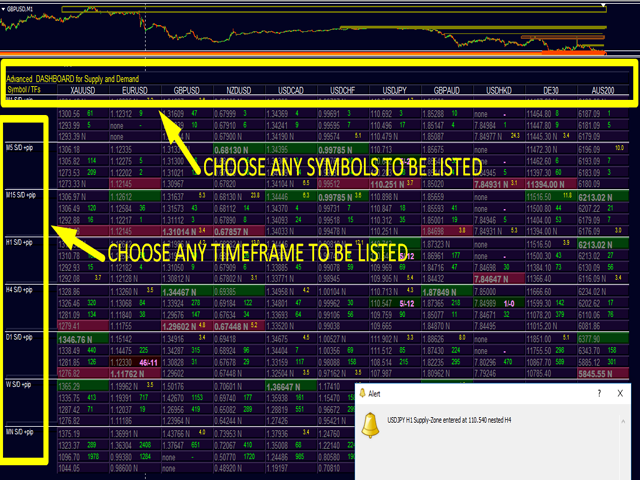
SYMBOLS AND TIMEFRAMES
Choose all the symbols and timeframes you want to be listed on the dashboard.

Add or change any symbol. show or hide any timeframe.

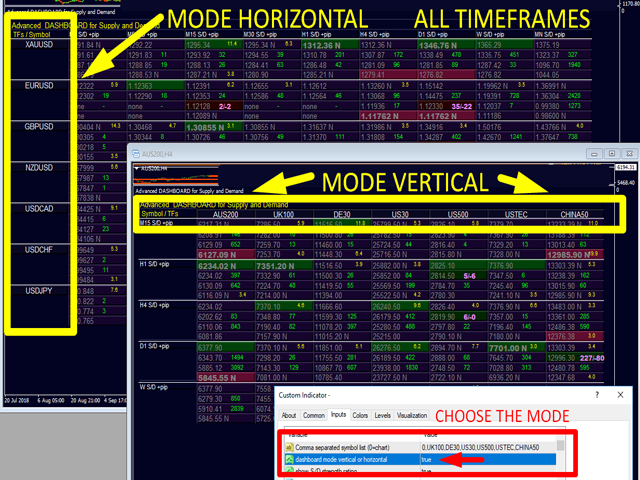
VISUAL MODE
Choose the main dashboard mode. Vertical or horizontal:

4 KIND OF ALERTS:
- A new zone appeared.
- Price entered a zone.
- Price left the zone.
- The zone is broken.
- If you wish, you can filter all alerts for only nested zones.
- You can choose the timeframes which should be alerted.
- You can exclude symbols from the alert.

VISUAL FEATURES ON DASHBOARD
- Prices for supply and demand. (From up to down: supply upper price / supply lower price / demand upper price / demand lower price)
- Pips distances until supply and demand. Green, if price is far from zone.
- Pips distances within supply and demand. Pink and bold, if price has entered the zone. (pips to outer price / pips to inner price)
- A special zone strength rating. Yellow number, if a minimum strength is reached.
- New or tested: “N” is added to price if the zone is still untested or new.
- Nested: the background is highlighted if the zone is nested within the higher timeframe zone.
- Nested AND new: Prices for supply and demand showing in bold.

VISUAL FEATURES ON CHART
Simply drag the sub-window of the dashboard down with the mouse to see the actual chart. Click on the symbol names to change the symbol.
- All timeframes showing in the dashboard will be drawing on the chart.
- Lower timeframes than the chart showing as dashed squares.
- Actual timeframe of chart showing as full squares.
- Higher timeframes than chart showing as empty squares.
- The higher the timeframe is the more to the right the squares end.
- Color code will show if the zone is new or tested.
- Prices can be shown on the chart or not.
The picture below shows an example with 5 timeframes for US30, but if you want you can show all 9 timeframes.

Version 1.5 released today 2019.05.30
A new filter for alerts has been added to do alerts only if the zone is new or untouched. (Excluding break alert.)
New input:
- alert only new zones (excluding breaks) (default = false)
To activate the filter set above input to true.
If false, the info will anyway be included into the alerts.
Example Alert: EURUSD H4 Demand-Zone (untested) entered at 1.11333 nested D1
Version 2.0 2020.10.22
MAJOR UPDATE 2020
==================
Added optional: Supply and Demand zones with ENGULFING BARS pattern at the beginning of the zone.
Use reversal candle color for bar 1 or bar 2 (the one before). Use either one or both.
Use a true engulfing pattern for the above-mentioned bars. (Must choose above.)
By default the use is false. To use the function you must set the new inputs = true (The selection is copied to all timeframes).
New inputs:
==== Candle pattern
- use reversal candle color bar 1
- use reversal candle color bar 2 (both or either)
- use true engulfing pattern (choose above)
MODIFICATION FOR ZONE SIZE
It was added optionally: Including a wick for the width of the supply and demand zones.
New input:
- Include wick 1 for the zone size
By default, the function is not used. To use the function, you must set the new input = true (The selection is copied to all timeframes).
Since the zones will be wider, some zones could be filtered. You may want to use lower XY factors.
How to update:
Possible you have to wait 24 hours until it is available for update.
Terminal’s showcase “Market” is updating once in 24 hours. If you don’t see any updates – that means 24 hours haven’t passed yet. You have to wait for showcase update.
If a new version of a product is available, you will see the corresponding message against it as well as the “Update” button.
Once this button is pressed, the new version will be downloaded. The new file replaces the previous one. Thus if you need, save the old version copy the file under a different name or outside of the directory [platform data folder]\MQL5\Market\.
To install updated version immediately delete the product from Navigator window (or better safe/drag the file to another folder outside of MT4), restart the terminal and try to install purchase from Terminal – Market – Purchased tab. This will be free and cost no activation.
Strategy tester
ATTENTION: To get the demo work in the strategy tester it needs a special setup since it’s a Multi-Symbol and Multi-Timeframe Dashboard. Also you need to prepare chart data quotes. Please see below comment 1. Send me email if you need help [email protected] (You can also try instead the demo of Advanced Supply Demand which works just in a similar way.) I can assure you it will run perfectly after purchase.
Specials !
Discounts are available for MT4 versions, now.
Special: Save 20% Off
Sale has started!
Profit now with a lower price. Limited offer with discount MT4.
Original Price: 250$
Discounted Price: 199$
With discount 20% OFF!
Get it now!
MT4 CLICK HERE
I will always help you if you have any questions.
For more details and questions email me at [email protected]
I wish you many green pips in the future.
Best regards, Bernhard
Attention! All my products can be bought only here, on the official MQL5 website. Beware of scammers!
Place a comment on the indicator page at mql5 so we can verify your access for our forum and other bonuses in the future.
THIS MANUAL WILL BE continuously be UPDATED !! So check again.
READ ALSO THE NEXT 20 COMMENTS.
Share it with friends:
Reviews
There are no reviews yet.
Related products
-98%

SLK Fintech EA
$24.99
FREE v2 Indicators
$0.00
-82%

MASR Bands
$8.99
-95%

FXCore100
$19.99
-99%
Scalper AvtomatFX
$27.99
-93%
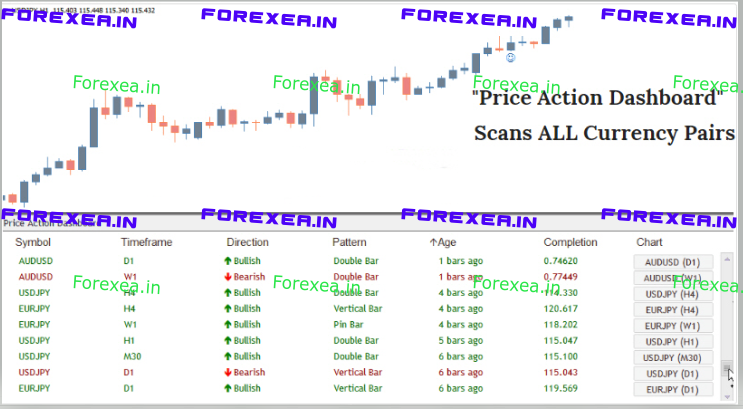
Price Action
$7.19
-94%
64666
This blog will be frequently updated.
Advanced DASHBOARD for Supply and Demand is based on the main indicator Advanced Supply Demand.
If you are new to supply demand trading read also https://www.mql5.com/en/blogs/post/720245
=======STRATEGY TESTER DEMO======
ATTENTION: To get the demo work in the strategy tester it needs a special setup since it’s a Multi-Symbol and Multi-Timeframe Dashboard. Also you need to prepare chart data quotes. Send me email if you need help [email protected] (You can also try instead the demo of Advanced Supply Demand which works just in a similar way.)
Start with a very simple setup.
Open EURUSD chart on H1 and on H4 and scroll each one back to download chart data.
Open indicator properties and set symbols = 0 and choose only H1 and H4.
Use control points and run with a near date (like last week) and a slow speed.
Ones the tester succeed you can try to add more timeframes.
Check on tester Journal tab to see the alert messages.
Below a test with 4 timeframes and a single pair:
Check the alert messages in the Journal tab.
Below showing all timeframes from M1 until D1 worked. Weekly can not be used in strategy tester.
The trick is to set the input symbol list = 0
Well, I tried and after a while it was OK with more symbols. Just turn the Weekly off. This timeframe is not supported on strategy tester.
Edit: Well, I tried and after I have run the tester directly on Weekly and Monthly it seemed to download also those timeframes. After that those timeframes worked also on strategy tester.
How to download, update or install the indicator go to Terminal / Market / Purchased within your MT4/5 (Ctrl+T).
Step by step instructions go here: Check the user manual for Impulse comment 7 on “How to install the indicator?”
https://www.mql5.com/en/blogs/post/697135#comment_5261974
64666
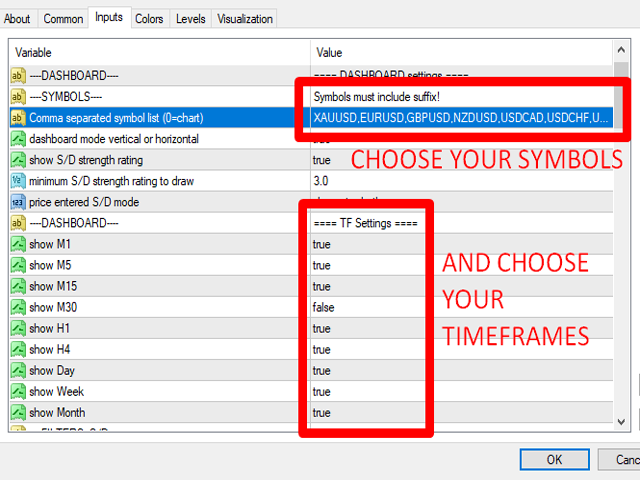
The list of all input parameters.
Of course you can just use the default settings. For detailed description see the 20 comments below.
==== DASHBOARD settings
Symbol names must include suffix!
==== TF Settings ====
==== Supply Demand settings ==== // —-FILTERS–S/D—-
==== Candle pattern ====” // —-optional patterns at beginning of zone—-
==== Specials ==== // —-optional zone settings—-
==== Alert settings ==== // —-DASHBOARD—-
Example Alert: EURUSD H4 Demand-Zone (untested) entered at 1.11333 nested D1
==== general Alert settings ====
==== on Chart settings ==== // —-on Chart—-
==== Color Settings Dash==== // —-on Dashboard—-
==== Color Settings Chart==== // —-on Chart—-
==== other settings ==== // —-on Chart—-
==== Other Settings // —-on Dashboard—-
64666
Actual screenshot. (Horizontal mode)
Symbol list: XAUUSD,EURUSD,GBPUSD,NZDUSD,USDCAD,USDCHF,USDJPY,GBPAUD,USDHKD,DE30,AUS200
You can freely edit and change the symbol list. It must include the full symbol names as it is. Upper and lower case sensitive.
Note: do not use a space between the commas!
64666
Actual screenshot.
Same symbol list as above but vertical mode.
64666
Actual screenshot. (vertical mode)
Small selection of symbols and timeframes.
Indexes. Symbol list: AUS200,UK100,DE30,US30,US500,USTEC,CHINA50
64666
On Chart:
Suppy and Demand zones of Gold.
Daily Chart showing all lower timeframes (dashed) and D1 (full) and all higher timeframes (empty squares). Of course you can select lesser.
64666
Working with multiple charts (3). Each one has its own symbol list and its own selected timeframes.
Running fast and without delay 🙂
If your monitor is small the easiest way is to split the Supply and Demand Dashboard PRO for 2 or more charts. Share the symbol list for each one.
Optional setting:
64666
Working with multiple charts (3). Each one has its own symbol list and its own selected timeframes.
Running fast and without delay 🙂
With the time alerts popping up from those 3 charts. The trader knows how to take action.
The alerts been modified with version 1.5
New input:
Example Alert: EURUSD H4 Demand-Zone (untested) entered at 1.11333 nested D1
(Small timeframes are only used for testing purpose. But all works perfectly.)
64666
Adding more symbol names to the list is easy. Just do it on Notepad and copy/paste to the symbol names input.
Quickly change the symbol on chart by clicking on the names on the dashboard.
Do not miss out on good opportunities like in the picture below with a triple nested demand zone.
64666
Selected Forex, selected timeframes:
horizontal mode
quickly see multiple nested zones in the row.
GBPUSD Demand: H1 nested in H4 nested in D1
USDCAD Demand: M15 nested in H1 nested in H4 nested in D1
64666
Update:
Today, I changed the product name to “Supply and Demand DASHBOARD PRO” because it was to similar to the other dashboard, “Advanced Dashboard for Currency Strength and Speed”. It might have lead to people miss click the wrong product when purchase.
Strategy tester: ATTENTION: The demo doesn’t work in the strategy tester right away since it’s a Multi-Symbol and Multi-Timeframe Dashboard. You need to prepare your chart data of MT4. Check comment 1. But I can assure you it will run perfectly after purchase. (You can also try instead the demo of Advanced Supply Demand which works just in a similar way.)
I added a 1 month rent to make it more easy for you to test.
A 20% discount is available as well.
64666
Multiple applications:
MAJOR UPDATE 2020 Version 2.0
==================
Now with ENGULFING BARS pattern!
Added optional: Supply and Demand zones with ENGULFING BARS pattern at the beginning of the zone.
This function was requested by traders. By default the use is false. To use the function, you must set the new inputs = true.
How it works:
Checking opposite candle color on main bar of the beginning of the zone.
Checking opposite candle color on previous bar of the beginning of the zone.
Choose bar 1 or bar 2 or both. If using both, a pattern can be on one or the other bars.
This will make sure the latter candle ‘engulfing’ the entire body of the candle before it.
Download below 2 templates:
Additionally, the higher timeframe will copy that setting.
Since the zones will be wider, some zones could be filtered. You may want to use lower XY factors.
64666
Visual signals:
USDCHF: Price has entered H4 supply.
The background of the second number changed to darkgreen.
The number for pip distance changed from green to pink. Now we have 2 numbers. The first number shows how many pips are until the upper price of supply, the second shows how many pips are from the lower price (12/-3).
Yellow numbers: A special zone strength rating if a minimum strength is reached.
64666
Nested zones and pips within:
What the dashboard and the chart tells us:
GBPUSD: We see a cluster of demand zones. (Lower demand background price on dashboard is darkred highlighted from M15 until H4)
M15 is nested in H1, H1 is nested in H4, H4 is nested in D1.
Price has entered D1 demand. It is 75 pips away from lower price and 48 pips from upper price.
M15 and H4 demand is new/untested (N).
H1 demand has a zone strength rating of 7.1 which is much but it has been tested. There was already a good trade opportunity.
64666
The use of TARGET CHART:
Set Input “charts open in new window” = true.
By clicking on the dashboards symbol names it will now open a target chart and keeping that chart for future change by other clicks.
Resize the new chart window to your needs and keep it.
You can now add your personal indicators to that chart.
Working now with 2 chart windows put both in the right place.
1 template and 1 profile (using target chart) are to download below for 14 pairs with alerts. (SDDP 14FX)
64666
Crypto Currencies:
horizontal mode
Symbol list: BTCUSD,BCHUSD,DSHUSD,ETHUSD,LTCUSD,XRPUSD
64666
Vertical mode.
Silver, Gold, Palladium, Platinum, Brent Oil, Natural Gas, Crude Oil
Symbol list: XAGEUR,XAGUSD,XAUEUR,XAUUSD,XPDUSD,XPTUSD,XBRUSD,XNGUSD,XTIUSD
64666
Setup for scalpers
Timeframes: M1, M5, M15, M30, H1
Symbol list: EURUSD,GBPUSD,NZDUSD,USDCAD,USDCHF,USDJPY,AUDUSD,EURGBP,EURJPY,GBPJPY,EURCHF,GBPNZD,EURAUD,CADJPY
Alert: only nested zones
The general setting is the MT4 popup with sound for all alerts. You can set to true email and push notification. (See comment 4 on Impulse)
For developers who want to import the zones to an EA.
You can import all price levels to your EA.
HOW TO GET A SAMPLE CODE
A sample code for integration can be ordered from our clients.
Send me a copy if you kill the market…
64666
For long term traders (swing trader).
Same symbol list as above: EURUSD,GBPUSD,NZDUSD,USDCAD,USDCHF,USDJPY,AUDUSD,EURGBP,EURJPY,GBPJPY,EURCHF,GBPNZD,EURAUD,CADJPY
Timeframes: H4, Daily, Weekly, Monthly
Alerts H4 and Daily.
64666
This blog will be continuously be updated.
Special: Save 20% Off
Sale has started!
Profit now with a lower price. Limited offer with discount MT4.
Original Price: 250$
Discounted Price: 199$
With discount 20% OFF!
Get it now!
MT4 CLICK HERE
I will always help you if you have any questions.
For more details and questions email me at [email protected]