

- Your cart is empty
- Continue Shopping


Hurst Index
Hurst Index

$12.99
-63%Add to cart
Buy Now
Product Description
Hurst Index
- Utilities
- Dmitriy Piskarev
- Version: 1.0
- Activations: 25
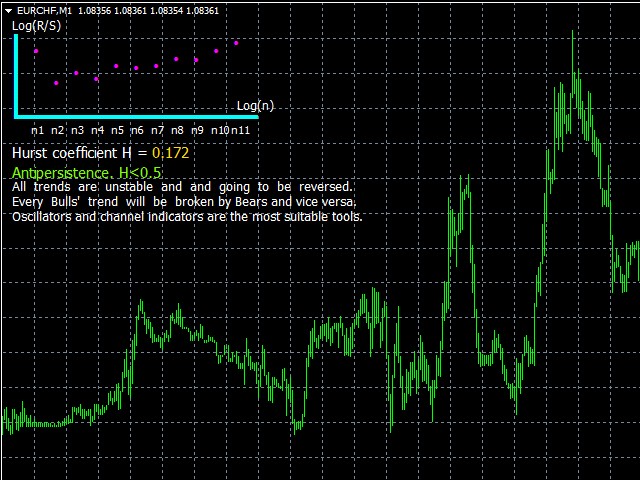
“Hurst index” is the analyzer of the the selected currency pair market fractal structure by using the R/S-analysis.
The analyzer determines, by calculating Hurst index, whether the market tends to keep the trend (persistence), or direction in the past most likely will be replaced by the opposite direction in the future (antipersistence).
Hurst Exponent
The Hurst exponent is used as a measure of long-term memory of time series. Studies involving the Hurst exponent were originally developed in hydrology for the practical matter of determining optimum dam sizing for the Nile river‘s volatile rain and drought conditions that had been observed over a long period of time. Benoît Mandelbrot believes the same effect can be generalized on Financial markets.
- If the Hurst index ranges from 0.5 to 1, the process must be characterized by long-term memory. In other words, there is persistence.
For example, “blue chips” (Apple, IBM, Microsoft stocks) have persistent time serieses.)
- If the Hurst index ranges from 0 to 0.5, the process must be characterized by antipersistence. For example, second-tier stocks.
Analyzer principle of calculation
- The analyzer calculates Hurst index for the last 1000 or 100 bars;
- The graph, numeric value of Hurst index and conclusion will be shown on the main window;
- If new bar have formed analizer recalculate coefficient.
Input parameters
- NumberOfBars – Set the number of investigated bars. The key parameter. Hurst index can be calculated for 1000 or 100 bars. If you try to specify a different value an error message will appear on the screen. For the purity of the experiment it is highly recommended to use 1000 bars for calculation that ensure the accuracy, significance and reliability of calculations;
- OffsetX – set the ofset of the analyzer graph on the program main window relative to the horizontal axis. Remember: the “zero point” is the upper-left corner of the window.
- OffsetY – set the ofset of the analyzer graph on the program main window relative to the vertical axis.
- SetAxisXcolor – X-axis color.
- SetAxisYcolor – Y-axis color.
- SetTextColor -Text color.
- SetHurstColor – numeric value of Hurst index color.
- SetGraphColor – the graph points color.
(!) It is highly recommended to use default values.
How to use
Hurst index will help you adjust your trading strategy and it doesn’t matter whether you are long-term, medium-term or short-term investor in the Forex market.
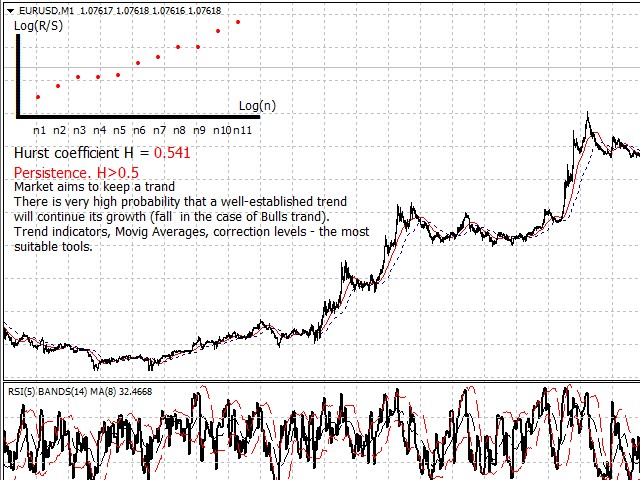
- If the market is persistent it means that market aims to keep the trand. There is very high probability that a well-established trend will continue its growth (fall in the case of Bulls trand). The higher value of the Hurst index (H) means stronger the market’s ability to persistence.
Trend indicators, Movig Averages, correction levels – the most suitable tools.
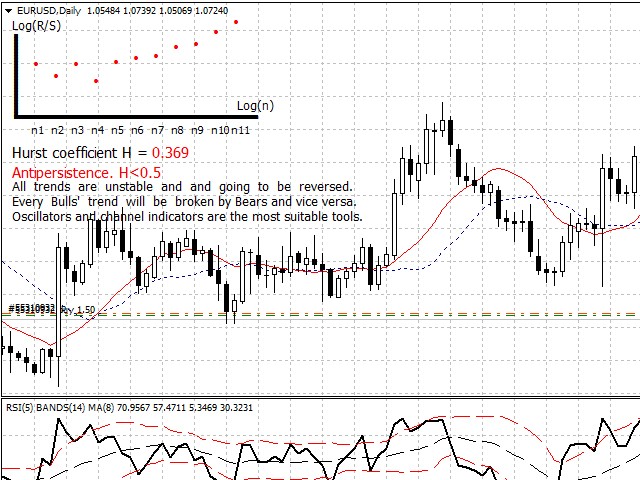
- If the market is antipersistent each trend is unstable and and tendency is going to be reversed. Every Bulls’ trend will be broken by Bears and vice versa. The lower value of the Hurst index (H) means the stronger market’s ability to antipersistence.
Oscillators and channel indicators are the most suitable tools.

Related products
-78%
KopirMT4 Copy trades for MT4
$21.99
-87%

StrategyQuant EA Builder
$60.00
-90%
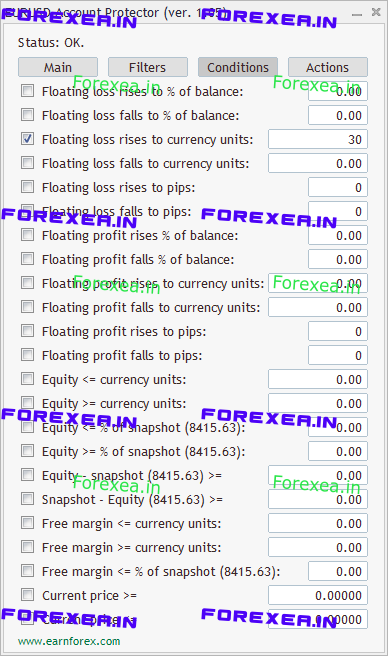
Account Protector
$9.69
-85%

VirtualTradePad mt4 Extra
$14.99
-90%

-74%
Copier4Fee Advanced
$12.99
-88%

GerFX EA Protection Filter
$14.99
-96%

Equity Entry EA
$12.99
Reviews
There are no reviews yet.