

- Your cart is empty
- Continue Shopping


Statistical support Resistance
Statistical support Resistance

$12.99
-81%Add to cart
Buy Now
Product Description
Statistical support Resistance
⭐⭐⭐⭐⭐ Support and Resistance levels are not fixed. They are not even a static levels in a day and they will change hourly by market fluctuations.This is why most of the times Pivot-Points that are calculated based on previous day Open-High-Low-Close do not work.
You have probably lost plenty of money as a trader until now because of the wrong SL and being hunted by SL hit. There are many types of support/resistance indicators (methods) but most of the times they are not accurate enough. Traditional and classic indicators that show Support/Resistance levels, representing miss leading levels that are not actual based on current market volatility. Fibonacci is good, but not good enough and professional traders have experienced many times that the price broke out the key level of 61.8 % without any reaction or retracement.
Promotional limited time on sale for 49$. Please add a 5 star review. It helps me to continue and update this indicator.
After this limited time the product price will return to normal price of 89 $.

Reviews 36
2912
I have bought many indicators from MQL5 and this is the first product I am giving a five star rating. Well worth the purchase. It can be improved further if you could add a feature of distance to the nearest support and resistance in terms of pips etc which is variable with price movement.

589
Pivot-points are not always accurate and most of the times those pivot points price action are minor and rely on it, is a big mistake that will cause SL hit. Round numbers or Moving averages are inconsistent and uncertain, so traders do not know how much likely the price whether break out the those levels or react.
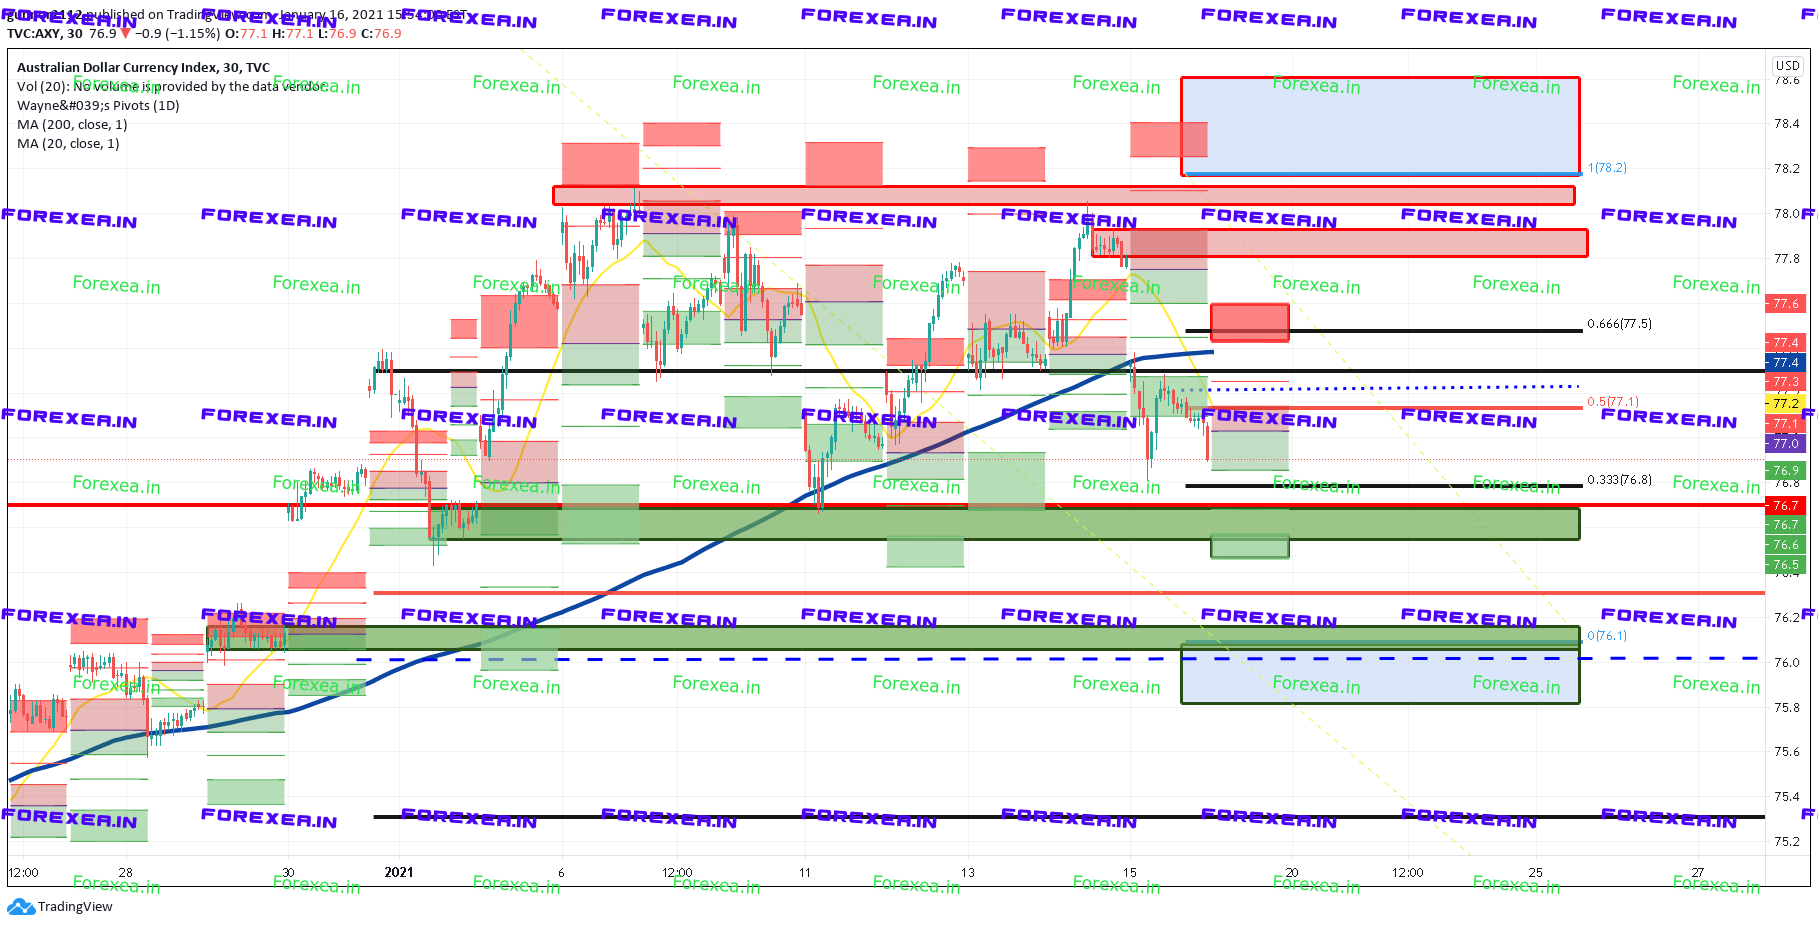
So what is the solution? This indicator (Statistical Support/Resistance) draws sophistical levels based on statistics and probability with putting in market volatility. It gives traders the choice power to set TP, SL, and target according to proven levels having higher probability. To know levels with higher probability, helps traders to detect best levels for price action and market move.
This indicator is one of the best for binary option traders who needs to have market move target and probability of reaching to that target.
Features:
- Show four levels for each support and resistance
- Each level has specific break out probability
- Calculation is based on last 24 hourly candles
- In some cases, calculation is based on only today OHLC Candle
- Prevent trader being trapped by SL hunting
- Determine how much is the probability that price may break out the level
- Show spread of symbol and remained time that the candle get close
- Levels are dynamic so new candles results new levels
Inputs:
- Color: the color of text
- Corner: chart corner that information is going to be present
- Font size of information
- Font size of level names
- Time frame of calculating levels [it should be always greater than current time frame]
Related products
-89%

-89%
True Direction Oscillator
$10.99
-100%

Franklin EA
$8.99
-99%

Scalper AvtomatFX
$27.99
-90%
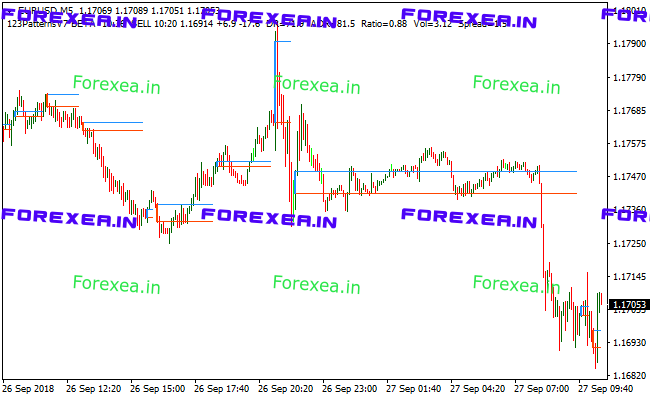
123PatternsV7
$7.19
-93%
Price Action
$7.19
-85%

PipFinite Breakout EDGE
$14.99
WyattsPivots
$0.00
Reviews
There are no reviews yet.